A function to calculate summary statistics of a set of data.
Arguments
- x
A vector of numeric values.
- sigf
The number of significant figures to report (optional).
- varname
The name of the variable (optional), character so in quotes e.g. "Clay content". If not used then the variable is called x on plots.
- plot
If
TRUE, a plot is part of the output. IfFALSE, plot is not part of output (default isTRUE).
Value
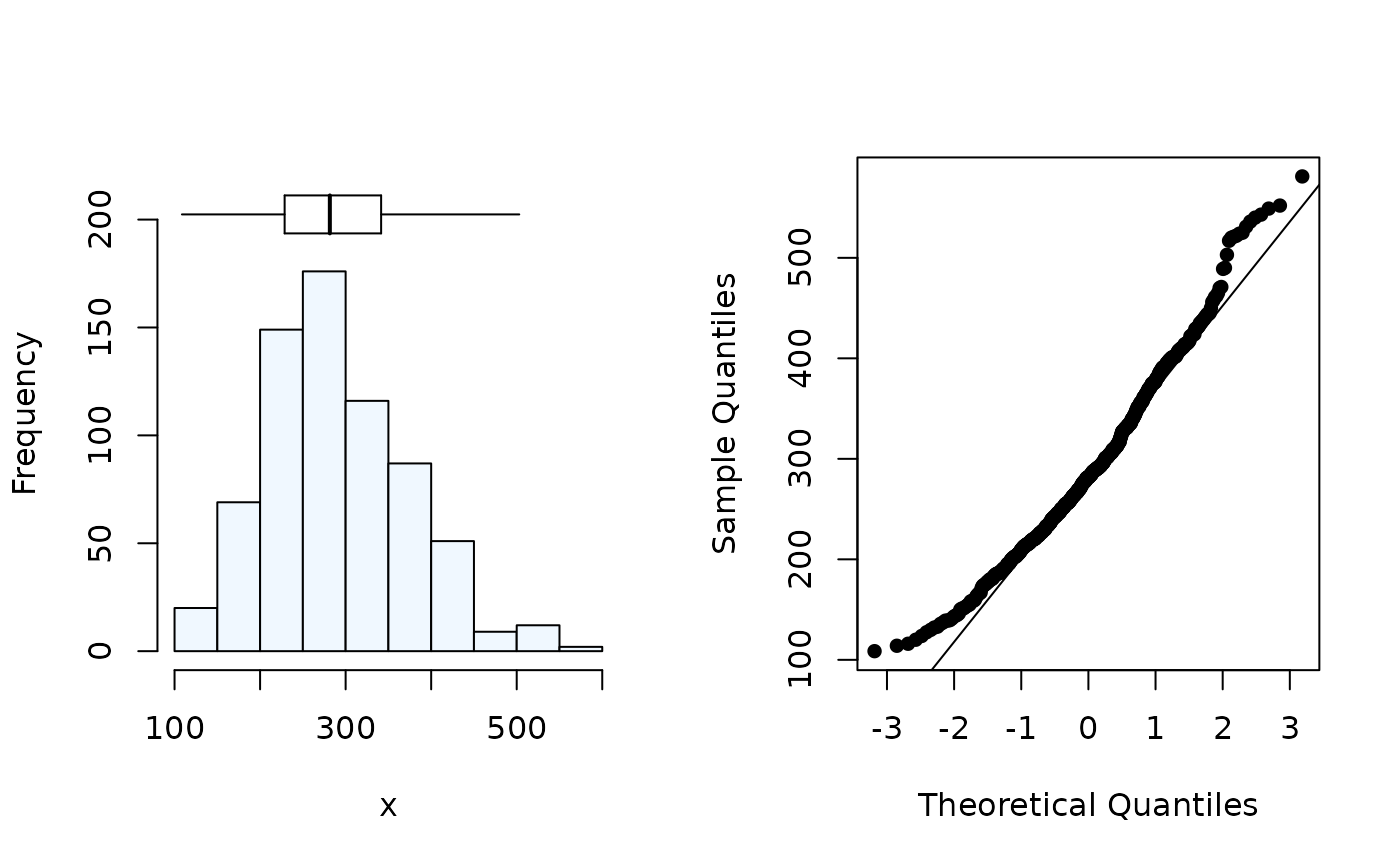
A matrix containing the mean value, median value,
first and third quartiles, sample variance, sample standard deviation,
coefficient of skewness, octile skewness, coefficient of kurtosis and
the number of probable outliers in a data set. A histogram with a boxplot
over it and QQ plot of the variable x if plot=TRUE.