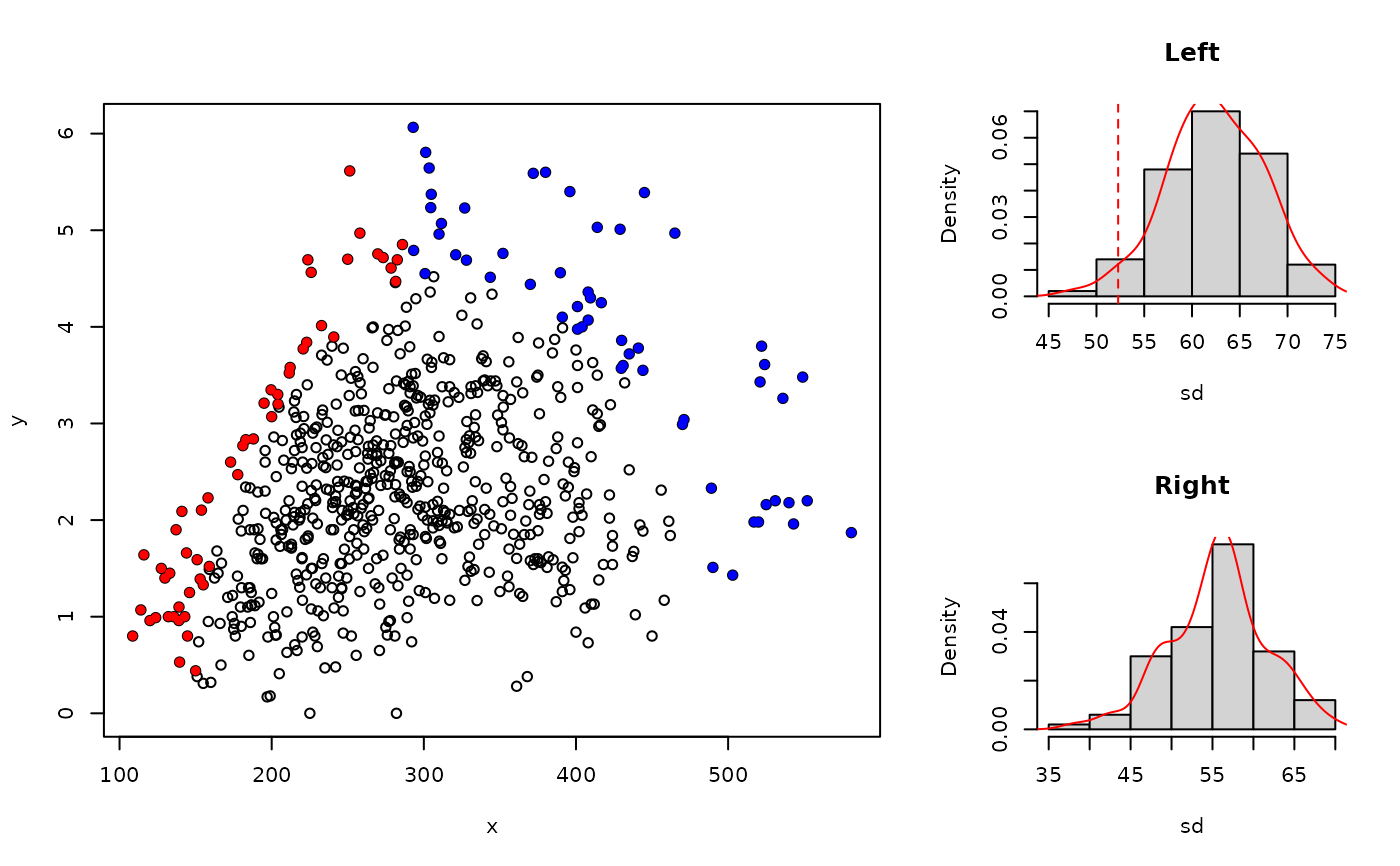
This function determines the probability of having bounding effects in a scatter
plot of of x and y based on the clustering of points at the upper
edge of the scatter plot (Miti et al.2024). It tests the hypothesis of larger
clustering at the upper bounds of a scatter plot against a null bivariate normal
distribution with no bounding effect (random scatter at upper edges). It returns
the probability (p-value) of the observed clustering given that it a realization
of an unbounded bivariate normal distribution.
Arguments
- x
A numeric vector of values for the independent variable.
- y
A numeric vector of values for the response variable.
- shells
A numeric value indicating the number of boundary peels (default is 10).
- simulations
The number of simulations for the null bivariate normally distributed data sets used to test the hypothesis (default is 1000).
- method
This describes the measure of boundary points compaction. The methods include
"sd-enclidean"for the euclidean distance standard deviation of the each boundary point to the center of data,"Area"for the perimeter around the boundary points and"Perimeter"for the area covering the boundary points.- alpha
a relative measure of concavity of polygon if method is set to
"Area"or"Perimeter". 1 results in a relatively detailed shape, Infinity results in a convex hull. We recommend values in the range of 1 - 5.- plot
If
TRUE, a plot is part of the output. IfFALSE, plot is not part of output (default isTRUE).- ...
Additional graphical parameters as with the
par()function.
Value
A dataframe containing the measures of peel compaction in the left and right sections of the data with their corresponding probability values.
Details
It is recommended that any outlying observations, as identified by the
bagplot() function of the aplpack package are removed from
the data. This is also implemented in the simulation step in the
expl_boundary() function.
References
Eddy, W. F. (1982). Convex hull peeling, COMPSTAT 1982-Part I: Proceedings in Computational Statistics, 42-47. Physica-Verlag, Vienna.
Miti. c., Milne. A. E., Giller. K. E. and Lark. R. M (2024). Exploration of data for analysis using boundary line methodology. Computers and Electronics in Agriculture 219 (2024) 108794.
Park, J.-S. and Oh, S.-J. (2012).A new concave hull algorithm and concaveness measure for n-dimensional datasets.Journal of Information science and engineering,28(3):587–600.